 When we plan for resilient communities and a resilient region, we are only ever as prepared and as resilient as our most vulnerable residents. When we analyze the potential impacts of climate change, we need to consider that infrastructure impacts affect our residents, but, more importantly, impacts associated with climate change may affect our residents more directly and personally.
In 2017, a capstone class at the University of Minnesota used our Localized Flood Map and Extreme Heat Map to assess human vulnerability to impacts associated with localized flooding and extreme heat.
Purpose
The Council asked the students to address two main questions:
-
Which areas within the metropolitan region are most vulnerable to flooding and extreme heat?
-
How do these areas of vulnerability affect communities based on known socio-economic data and social vulnerability indicators?
Analysis
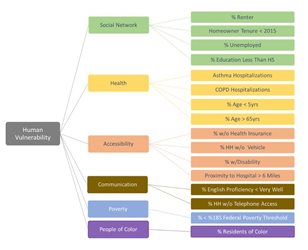
The team of students expanded the definitions of social and socio-economic vulnerability beyond textbook definitions to better encompass the full spectrum of human vulnerability. The Human Vulnerability Index developed in the report focuses on indicators such as income, race/ethnicity, and education, but it also addresses health, accessibility, communication, and social networks.
The report uses spatial analysis to examine specific human vulnerability indicators, developed and detailed in the Human Vulnerability Index, in relation to place-based climate hazards of extreme heat and localized flooding.
Climate Vulnerability Assessment (CVA) Human Vulnerability documents:
Strategies & Recommendations
Given the high level of the analysis and the nuance of both human and human vulnerability and climate event data, this report focuses on mitigation and adaptation strategies for identified climate hazards. Within this framing, trees and stormwater management have been identified as “smart solutions” to effectively address multiple vulnerabilities. Recommendations for next steps in analysis, considerations, and applications are provided for the Metropolitan Council, the region, and for communities.
Limitations & Constraints
Given the broad, regional scope of this analysis, the results of the assessment are generalized and therefore illustrative. Local communities are encouraged to perform their own analysis, which can remove, for example, localized flooding areas that have appropriate stormwater infrastructure. A more community-specific analysis, when combined with socio-economic data, will produce results that better inform policy and implementation strategies at the community and neighborhood level.
The analysis is performed at the census tract level. Many rural census tracts are large, and this can reduce accuracy of the analysis. Also, climate hazard data, especially the localized flood data, should be verified at the local level to ensure accuracy. Finally, it is important to note that human vulnerability is people-based vulnerability, not place-based vulnerability. However, localized flooding and extreme heat hazards are place-based hazards. Human populations are naturally mobile, and the assessment is not able to accurately capture or quantify vulnerability with this fact in mind.
The contents of the report do not necessarily reflect the goals, policies, strategies, or views of the Metropolitan Council. Inaccuracies in data and findings are not the responsibility of the Council.
Other Resources
Two strong frameworks for guiding and executing an overall climate change vulnerability assessment for a community are the Saint Paul-Ramsey County Public Health Climate Change Vulnerability Assessment (PDF) and the MN Climate Change Vulnerability Assessment (PDF). The EPA’s Climate Change Adaptation Resource Center (ARC-X) walks through the MN Climate Change Vulnerability Assessment process and provides applicable EPA tools.