About the data
Traffic count data are provided by the Minnesota Department of Transportation (MnDOT). MnDOT maintains a network of sensors at approximately half-mile increments on every lane, exit ramp and entry ramp across the metro area freeway system. These sensors are a mix of simple magnetic field “loop” detectors and more sophisticated Weigh-in-Motion (WIM) sensors.
MnDOT serves data at 30-second increments, which is more detail than is needed for trend analysis. Met Council researchers process the raw data feeds, aggregate data to 15-minute increments, and perform several quality checks using our open-source R package, tc.sensors. These cleaned, 15-minute data are stored in a Met Council-maintained database.
To make the data useful to those most interested in regional and long-term trends, council researchers aggregate the data from multiple sensors (lanes) to the station-level and roll up to the hourly and daily level. Read more about the traffic forecasting and analysis collection methods maintained by MnDOT.
For a data extract at the level of individual traffic lanes or for 15-minute increments, email Ashley Asmus at [email protected].
Estimating “typical” traffic
To estimate typical traffic while accounting for weekly and seasonal fluctuations in travel, we used statistical modeling that relies on pre-pandemic traffic count data from January 2018 to March 1, 2020. The model relies on generalized additive models, or GAMs. GAMs are commonly used to analyze data with a strong seasonal or cyclical trend — especially when that trend does not follow a straight line. Some GAMs that people might already be familiar with are those that climate scientists use to estimate temperature trends within and across years.
Our traffic trend GAMs consider three trends. One trend happens over the span of a year: in most places, travel increases in the summer months and decreases in the winter months. A second trend occurs over the span of a week: travel tends to be highest on Fridays, and lowest on Sundays. Finally, for hourly models, we examined the variations in traffic that happen every 24 hours.
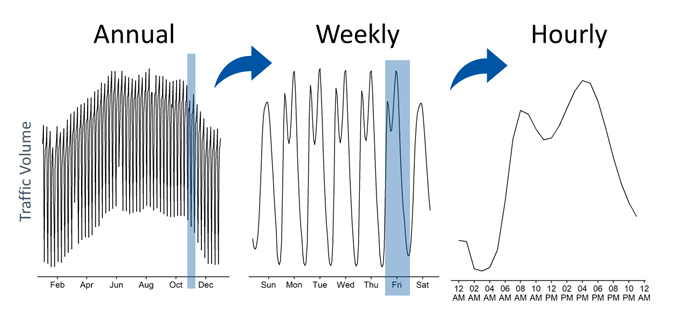 Line graphs show generalized trends at the annual, weekly and hourly level based on January 2018-March 2020 traffic data for a subset of the most reliable traffic stations.
To allow the shapes of these yearly and weekly trends to vary specific to location, we created separate models for each traffic monitoring station — each station might be made up of multiple lanes of traffic. We eliminated stations with poor data coverage across the historic baseline period from our analyses. We used our GAMs to generate predictions of expected or “typical” traffic for every station, day of the year, and hour of the day. We then estimate the difference from expected traffic as a percentage:

Negative values show where traffic counts are lower than expected; zero values indicate that traffic is at typical levels; and positive values greater than zero indicate that traffic counts are greater than baseline. To generate system-level trend estimates, or those across an entire corridor, we calculate the total observed and expected traffic for all working sensors on that day.
Expressing differences from normal as a percentage, rather than in raw numbers of vehicles, allows for more robust comparisons of traffic over time when sensors malfunction or go offline due to construction.
Limitations of the tool
Because our estimates of typical traffic rely on more than two years of data with good coverage, stations that went offline for an extended period during the historic baseline time frame (e.g., due to construction) will not be shown on the map. Similarly, recent road closures and projects may not always be detected and removed by our data quality check process. Data at the individual station level is less reliable than data at the whole-system or corridor level. Report data errors to [email protected] or by submitting an issue to our tool’s GitHub page.
Our GAMs do not account for holidays, special events or weather, except where they might have a strong effect on seasonal traffic trends (e.g., lower travel in the winter due to poorer driving conditions). Daily trend results should be considered with this in mind. Future iterations of the GAM models may account for these extra-seasonal effects.