Minneapolis and Saint Paul continue to lead growth in number of new residents
Population growth continues throughout the region, according to the Metropolitan Council’s community-level preliminary population estimates for 2019. Urban and older suburban areas continue to show strong growth, with Saint Paul reaching its highest population ever in 2019.
As household growth outpaces residential construction, however, the region’s housing vacancy rate has gone down, housing prices and rental rates have risen, and the shortage of housing and affordable housing has become even more acute.
“This region continues to attract growth with our diverse economy and livable cities,” said Chair Charlie Zelle. “But we continue to have a huge and growing challenge with housing affordability because housing production has not kept pace with our growth.
“This situation puts many more families at risk for having to choose between paying the rent and getting enough food or medical care — or even worse, homelessness, which has grown markedly since 2015,” Zelle said. “And now the pandemic is worsening and highlighting the magnitude of our region’s housing challenges.”
Local government officials will have an opportunity to review and comment on the preliminary estimates. By statute, the Council will finalize the estimates by July 15 for state government purposes, such as local government and street aid.
Several cities reach milestones
Several communities hit significant milestones in the 2019 estimates. Saint Paul reached its highest population on record at 315,925 residents (eclipsing the 313,411 residents it had in 1960). Bloomington rose above 90,000 residents for the first time, Lakeville’s estimated population is now above 65,000, Rosemount crossed the 25,000 threshold, and Victoria hit the 10,000 mark.
Most growth in region’s center
Growth is occurring across the region, according to the preliminary estimates, but the communities that have added the most people since 2010 are:
| |
2010 population |
2019 population (preliminary estimate) |
Growth, 2010 to 2019 |
Percentage growth, 2010 to 2019 |
| Minneapolis |
382,578 |
435,885 |
53,307 |
13.9% |
| Saint Paul |
285,068 |
315,925 |
30,857 |
10.8% |
| Blaine |
57,186 |
67,939 |
10,753 |
18.8% |
| Lakeville |
55,954 |
65,831 |
9,877 |
17.7% |
| Woodbury |
61,961 |
71,483 |
9,522 |
15.4% |
| Plymouth |
70,576 |
79,475 |
8,899 |
12.6% |
| Bloomington |
82,893 |
90,271 |
7,378 |
8.9% |
| Brooklyn Park |
75,781 |
82,444 |
6,663 |
8.8% |
| Maple Grove |
61,567 |
68,101 |
6,534 |
10.6% |
| Savage |
26,911 |
32,245 |
5,334 |
19.8% |
Similar to previous findings the region’s total growth breaks down roughly into thirds. Based on our Community Designations (PDF), Urban Center communities — Minneapolis and Saint Paul and the region’s oldest suburbs — have accounted for one-third of the region’s population growth since 2010.
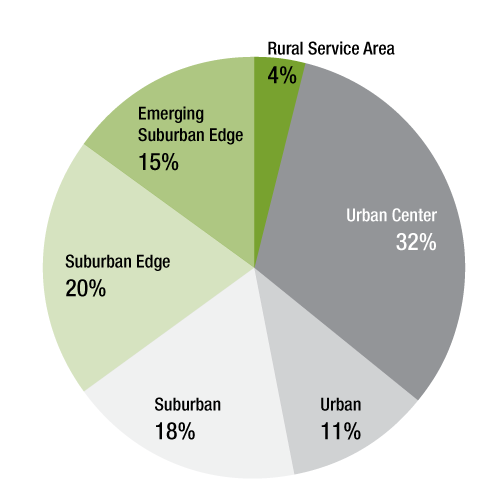
Urban and Suburban communities (cities that experienced their peak development before 2000, e.g., Brooklyn Park, Maplewood) accounted for nearly 30% of the region’s growth. Suburban Edge and Emerging Suburban Edge communities (which tend to have more developable land, e.g., Chanhassen, Woodbury) have accounted for the remaining one-third, with modest growth in more rural and agricultural communities.
Different kinds of development have contributed to this growth. Urban Center and Urban communities are growing primarily because of new multifamily developments like apartments and condominiums, while Suburban Edge and Emerging Suburban Edge communities are growing primarily because of new single-family homes (both detached homes and townhomes). Suburban communities’ growth reflects both single-family and multifamily housing.
Low vacancy rates, shortage of housing production, higher housing costs
According to the preliminary estimates, the region added 110,551 households between 2010 and 2019, but just 90,433 housing units. The remaining 20,118 households occupied existing housing, drawing down vacancy rates.
Vacancy rates dropped as the economy improved after 2010 and reached an estimated 3.8% in 2019, down from 5.8% in the 2010 Census. According to annual data from the U.S. Census Bureau’s Current Population Survey, vacancy rates in our region are at their lowest since the early 2000s and are some of the lowest in the country.
| |
Census April 1, 2010 |
Preliminary estimate April 1, 2019 |
Change, 2010-2019 |
Percent change, 2010-2019 |
| Population |
2,849,567 |
3,152,317 |
302,750 |
+10.6% |
| Households |
1,117,749 |
1,228,300 |
110,551 |
+9.9% |
| Housing units |
1,186,986 |
1,277,419 |
90,433 |
+7.6% |
About the Council’s population estimates
The Council’s estimates differ from those developed by the U.S. Census Bureau, scheduled for release on May 21. The Census Bureau uses an estimation method that relies on birth rates, death rates, and migration rates to arrive at county populations, then apportions those county populations to the various communities.
The Met Council’s method takes advantage of the latest available local information on each community’s housing supply, vacancy rate, and group quarters population.
“Our population estimates complement the work being done by the Census Bureau,” Zelle said. “Both agencies confirm that our region is growing steadily and becoming more diverse. Our work today has to be focused on planning for that growth, so people in the metro area have access to transportation, housing, employment and education.”
“Right now, everyone is focused on the COVID-19 pandemic,” he added. “But research like this helps us plan for our future as we emerge from this crisis. It has never been more important for every Minnesotan to participate in the Census, so we are able to get the maximum benefit from federal investments and so we have the data we need to plan for a more vibrant future.”
About the Met Council’s population estimates model