Population growth is occurring throughout the region—especially in communities with major transit investments. Those are among the findings from the Metropolitan Council’s community-level preliminary population estimates for 2017.
The preliminary estimates show growth continues to occur across the region, with the strongest growth occurring in urban and suburban areas. As population growth outpaces residential construction, however, the region’s housing vacancy rate has gone down, making for a competitive rental market and higher housing prices.
"The region’s steady growth across all corners of our region shows we continue to plan well at a regional level, with a diversified and competitive economy,” said Council Chair Alene Tchourumoff. “People want to come to the Twin Cities region, whether to work or live, because of everything we have to offer.”
“But with this growth comes challenges,” continued Tchourumoff. “If we do not continue to invest in key areas that promote prosperity, create choices for people, and reduce disparities, we will fall behind our peer regions.”
Those key areas include:
-
Transit – to ensure mobility and connect people to jobs;
-
Development – that is transit-friendly and promotes efficient land use;
-
Housing – that’s affordable and safe; and
-
Water – that’s clean and abundant.
Local government officials will have an opportunity to review and comment on the preliminary estimates. By statute, the Council will finalize the estimates by July 15 for state government purposes, such as local government and street aid.
Tchourumoff said the latest Greater MSP Regional Indicators show the region is losing ground in some areas, including housing and transit.
“Our fears of what happens when we don’t fund transit are coming true. Access to jobs via transit is a critical component for attracting and retaining workers. The Minnesota legislature has an opportunity to invest $50 million in expanding our region’s rapid bus system, building upon the success of the A Line. Their current bonding bills contain zero dollars for transit. It’s time to invest in transit and our ability to be economically competitive with our peer regions.”
Communities with existing or planned transitways have grown the most
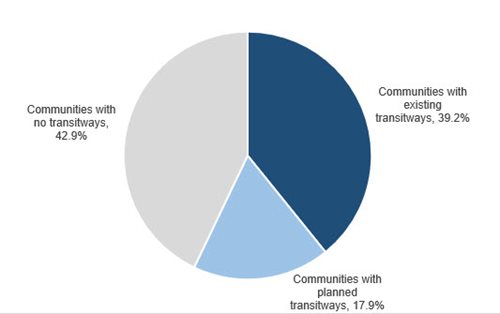 Communities served by existing or planned transitways have captured a majority of growth in the region. Nearly 40% of the region’s growth has occurred in communities containing existing transitways (the Blue Line, Green Line, Red Line, and A Line in the METRO system along with the Northstar commuter rail line). Another 18% has occurred in communities with planned transitways (the extensions of the Blue Line, Green Line, and Red Line; the Gold Line; the Orange Line and its extension; and the C Line and D Line).
Twin Cities region's housing vacancy rates declined
According to the preliminary estimates, the region added 83,100 households between 2010 and 2017, but just 63,670 housing units. The remaining 19,430 households occupied existing housing, drawing down vacancy rates.
Vacancy rates dropped as the economy improved after 2010 and reached an estimated 4.0% in 2017, down from 5.8% in the 2010 Census. According to annual data from the U.S. Census Bureau’s Current Population Survey, vacancy rates in our region are at their lowest since the early 2000s, and they are some of the lowest in the country.
|
|
Census
April 1, 2010
|
Preliminary estimate
April 1, 2017
|
Change, 2010-2017
|
Percent change, 2010-2017
|
Population
|
2,849,567
|
3,075,466
|
225,899
|
7.9%
|
Households
|
1,117,749
|
1,200,849
|
83,100
|
7.4%
|
Housing units
|
1,186,986
|
1,250,656
|
63,670
|
5.4%
|
Most growth occurred in region’s center
The preliminary estimates show that growth is occurring throughout the Twin Cities. The communities that have added the most people since 2010 are:
|
|
2010
population
|
2017 population (preliminary estimate)
|
Growth, 2010 to 2017
|
Percentage growth, 2010 to 2017
|
Minneapolis
|
382,578
|
423,990
|
41,412
|
10.8%
|
Saint Paul
|
285,068
|
309,180
|
24,112
|
8.5%
|
Blaine
|
57,186
|
65,369
|
8,183
|
14.3%
|
Woodbury
|
61,961
|
69,370
|
7,409
|
12.0%
|
Plymouth
|
70,576
|
76,882
|
6,306
|
8.9%
|
Lakeville
|
55,954
|
61,993
|
6,039
|
10.8%
|
Bloomington
|
82,893
|
88,885
|
5,992
|
7.2%
|
Maple Grove
|
61,567
|
66,814
|
5,247
|
8.5%
|
Brooklyn Park
|
75,781
|
80,866
|
5,085
|
6.7%
|
Edina
|
47,941
|
52,497
|
4,556
|
9.5%
|
The region’s total growth breaks down roughly into thirds. Based on the Council’s Community Designations, Urban Center communities—Minneapolis and Saint Paul and the region’s oldest suburbs—have accounted for one-third of the region’s population growth since 2010.
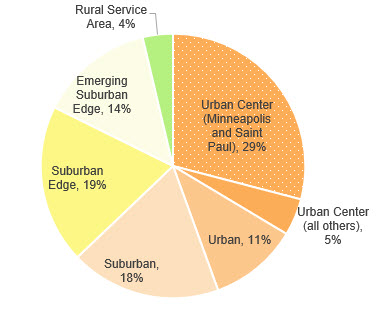 Urban and Suburban communities (cities that experienced their peak development before 2000, for example, Brooklyn Park and Maplewood) accounted for nearly one-third of the region’s growth. Suburban Edge and Emerging Suburban Edge communities (which tend to have more developable land, for example Chanhassen and Woodbury) have accounted for the remaining one-third, with modest growth in more rural and agricultural communities.
Different kinds of development have contributed to this growth. Urban Center and Urban communities are growing primarily because of new multifamily developments, like apartments and condominiums, while Suburban Edge and Emerging Suburban Edge communities are growing primarily because of new single-family homes (both detached homes and townhomes). Suburban communities’ growth reflects both single-family and multifamily housing.
Why do population estimates differ?
The Council’s estimates differ from those developed by the U.S. Census Bureau, scheduled for release on May 24. The Census Bureau uses an estimation method that relies on birth rates, death rates, and migration rates to arrive at county populations, then apportions those county populations to the various communities.
The Council’s method takes advantage of the latest available local information on each community’s housing stock, vacancy rate, and group quarters (for example, nursing homes) population.
More about the Council’s population estimates model.