2019 Household Survey Results: How We Move
Studying the way people travel in the region helps the Met Council plan future transportation service and infrastructure. This survey, along with other data — such as the census and regional development trends — help to paint a picture about how travel trends have changed and evolved. It is a tool used by the Met Council to help plan and fund future transportation projects and develop the region’s travel forecast models.

Key findings
-
Driving remains the main way people travel throughout the region, accounting for nearly 85% of trips, up slightly from 2010.
-
Transit use has remained steady compared to 2010 household survey data. Of those who use transit, 7% use transit weekly and 44% only use transit when attending an event.
-
51% of household trips are for everyday activities like healthcare visits, shopping, errands, or picking up and dropping off family members.
-
Weekend travel behavior, a new data set in this survey, captured dramatic new insights in social and recreational travel.
-
Electronic scooters and bike share, part of a group called micromobility, made their first appearance in the household survey; however, 89% of micromobility trips are made using a personal bicycle.
-
84% of walking trips are less than one mile and 75% are 20 minutes or less.
Examining the data
The makeup of the people who participated in the survey also shows us travel patterns by demographic and socioeconomic characteristics including age, gender, race and ethnicity, income, employment status, and disability. Below are some examples that surfaced in the initial data analysis.
People who have a disability
A person who has a physical disability takes about one less trip per day relative to those without disabilities. The data also show that disparities in travel for people who have a disability are greatest for work and for social travel, and greatest for older adults versus younger adults.
Gender
Women under age 65 take a lot more trips to serve their family, transport others to and from school/appointments, and take fewer trips for work. Women over 65 travel less than men of the same age group.
Race/ethnicity
Effective and fair decision-making requires data that accurately represents or reflects the population in the study area. The study design took three key actions to improve representation among historically underrepresented populations: 1) Oversampling groups that are historically under-represented in surveys (e.g., the Census) to increase participation; 2) Outreach to encourage participation; and 3) Reminders to encourage full completion of the survey. Council staff are investigating even more strategies to improve representativeness of the survey in 2020.
Overall, the data show some evidence of disparities in travel by race and ethnicity, especially in social/recreational and shopping/errand trips. Met Council staff will be conducting analyses to understand these disparities more completely in the context of life in the metro area.
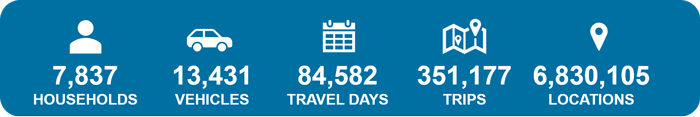
Collecting the data
The Travel Behavior Inventory household survey went into the field in October of 2018 and asked households to collect travel data over seven days using a smartphone app. A majority of the respondents averaged six out of seven days tracked, capturing weekend travel behavior that was never collected in previous surveys.
- Survey fielded from October 1, 2018 through September 30, 2019
- Smartphone participants completed a 7-day travel diary
- Online and call center participants completed a 1-day travel diary
- Same questionnaire was used for smartphone, online, and call center participants
- Survey was available in English, Spanish, Karen, Oromo, Somali, and Hmong