Trips lost and retained
The results show that of the 157,000 daily trips taken on these routes in 2016, 72,000 trips, or 46%, were retained in 2021.
By gender
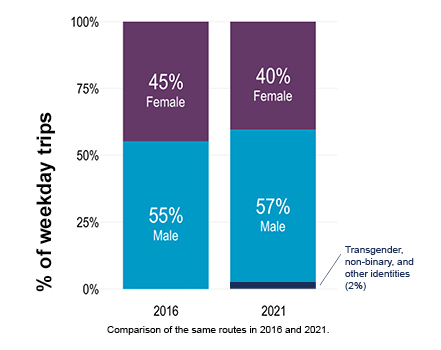
Of these trips, there was a greater share of trips retained taken by men, 47%, versus women, 41%.
What's more, the share of men on board has increased. The chart below shows that in 2016, 45% of trips were made by women and girls, and 55% by men and boys. In 2021, 40% of trips were made by women, and 57% made by men and boys. 2% of trips served those who identified as transgender, nonbinary, or other identities. The gender gap increased from 10 percentage points to 17 percentage points.
Of the trips that were retained, the greatest share of trips taken were by older men, and the least were by young women. The retention rate for men 65+ was 83% of the 4,000 trips made in 2016, while the retention rates for women 18-24 was only 31% of the 22,000 trips made in 2016.
By disability
People who have a disability and are served by these routes are largely still using the service despite COVID-19. The 2021 data show that these routes retained a greater share of trips by riders who have a disability — 71% of the 18,700 trips logged in 2016. In addition, the share of trips made by those who have a disability has increased from 11% to 18%.
By race or ethnicity
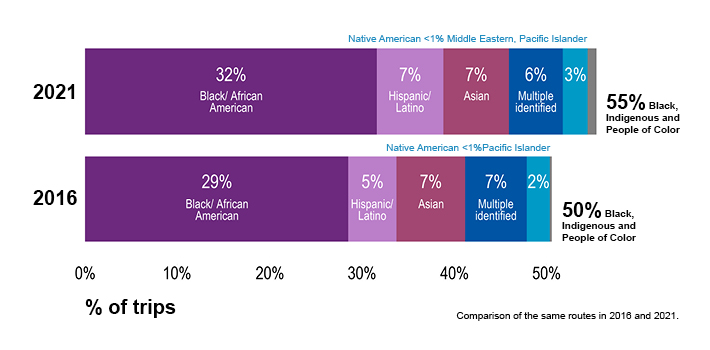
The data also show a greater share of trips made by Black, Indigenous, and people of color, the greatest share of 2021 retained trips was made by Hispanic/Latino riders, 62%, and American Indian/Alaskan Native riders, 48%. In addition, the share of riders who identify as Black/African American or Hispanic/Latino has increased from 2016.
The bar chart below shows that in 2016, 29% of trips were made by Black/African American riders, compared to 32% of trips in 2021. In 2016, 5% of trips were made by Hispanic/Latino riders, compared to 7% of trips in 2021. The share of trips made by Asian (7%), multiracial riders (6 to 7%), and Native American riders (2 to 3%) did not change as much. The total share of trips made by Black, Indigenous, and people of color increased from 50% in 2016 to 55% in 2021. This graph excludes the percent of trips made by white riders (45% of trips in 2021; 50% of trips in 2016).
By trip purpose
Transit trips represent a wide variety of purposes, including social, peak 9-to-5 commutes, off-peak commutes, school commutes, errands, dining, medical, and airport (passengers only). A good cross section of all these types of trips were retained from 2016 to 2021. While these trip types are all represented, there’s just not as many.
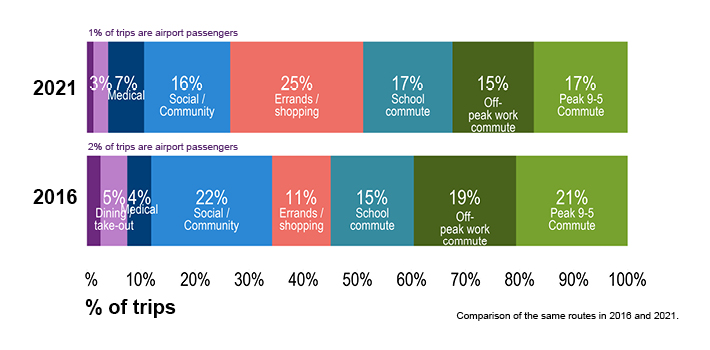
The 2021 data show that the greatest share of trips that passengers made were for errands. In addition, the share of people using transit for errands has grown. These essential types of trips are the ones that people have continued to take throughout the pandemic.
This bar chart shows the most common 2021 trip purpose was errands / shopping (24%), followed by peak 9-to-5 commutes (17%), and school commutes (17%). In comparison, 2016’s most common trip purpose was social (22%), followed by peak 9-to-5 commutes (20%), and off-peak work commutes (18%).
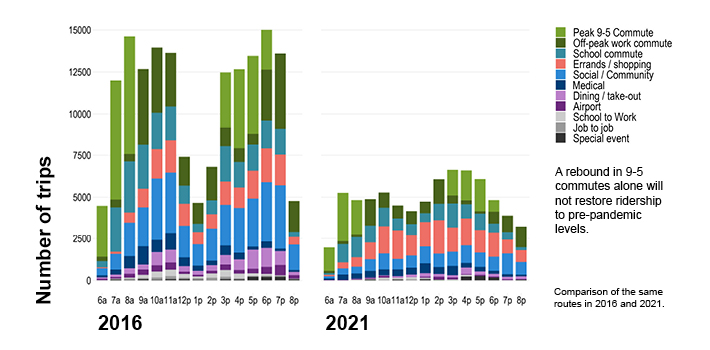
Researchers observed that ridership patterns changed dramatically from sharp peaks in the morning and evening rush hours before the pandemic to a smoother distribution of trips across the day throughout 2020 and 2021.
The new survey data on trip purpose has added context to this previously noted pandemic pattern. As expected, a reduced number of commute trips, especially those to and from 9-to-5 jobs, strongly contributed to the pattern. Surprisingly, a reduction in travel for social visits and school contributed almost as much as the lost commutes. These data make apparent that a completely restored 9-to-5 commute alone would not restore ridership to pre-pandemic levels.
The graph below is a side-by-side comparison of 2016 and 2021 transit on-board survey trip purpose data. It shows trip distribution across the day from 6 a.m. to 8 p.m. and shows the portion of trips made for each of the following purposes: peak 9-to-5 commute, off-peak work commute, school commute, errands / shopping, social / community, medical, dining / take-out, airport, school to work, job to job, and special event.