Fuel Usage
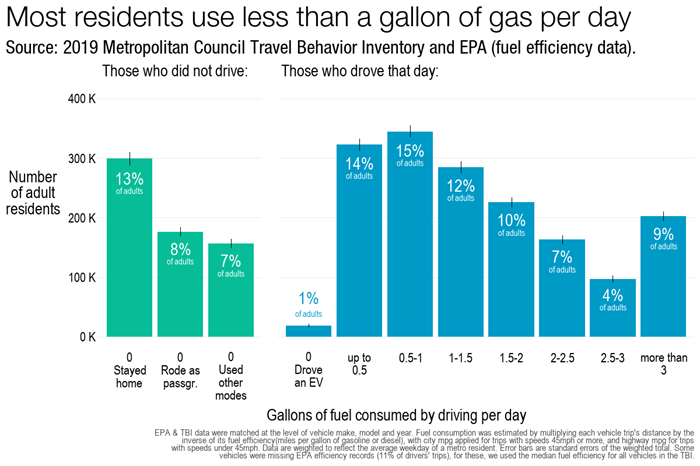
Fuel prices are a growing concern for Twin Cities residents, as they are across the country and world. A recent analysis of 2019 travel data shows that most residents use less than a gallon of gas a day.
This bar graph shows the percent of adult residents who didn’t drive at all, and the percent of those who drive and how much fuel they use per day. This also shows a small percent of drivers using an electric vehicle in 2019.
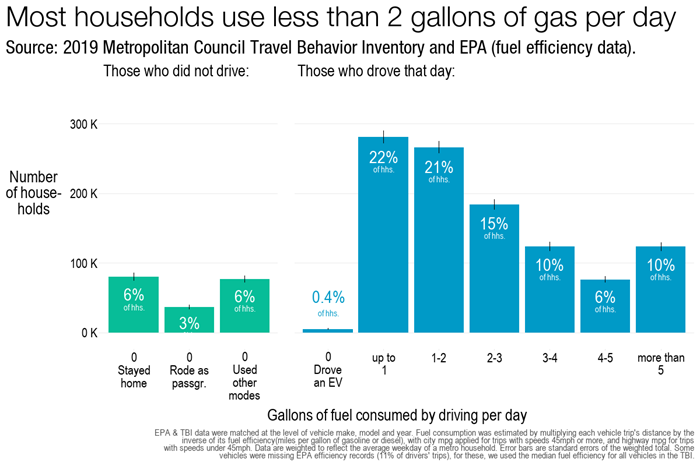
Fuel usage by household accounts for trips that include a passenger, whether driving a child or another person in the house who doesn’t drive. On average, Twin Cities households used 2 gallons of gas per day in 2019, with 10% of households using more than 5 gallons per day.
The bar graph below shows the percent of households that didn’t drive at all, and the percent that drive and how much fuel they use per day. This also shows a small share — just 0.4% — of households accomplishing all their daily travel in an electric vehicle in 2019.
Impacts vary across income and location
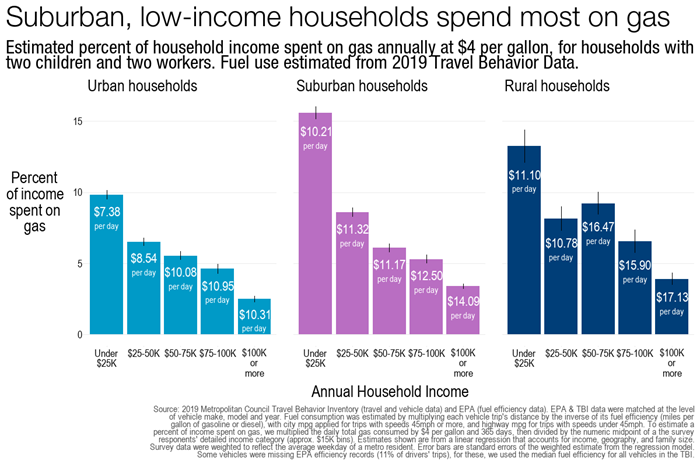
 In 2019, when gas was $2.42 per gallon, we estimate that households spent an average of 2.8% of their income on gas. If people drive the same amount today as they did in 2019, with gas at $4 per gallon, that share would increase to 4.5% of household income. The amount of a household’s income spent on gas varies with household size, income, and where people live. If people drive the same amount today as they did in 2019, when gas prices are $4 per gallon, low-income households with two workers and two kids could spend up to 15% of their income on gas.
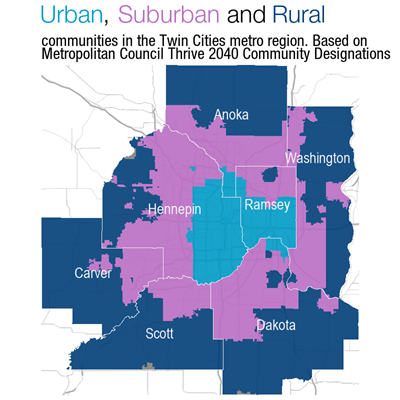
This bar graph shows households and the percent of income spent on gas, segmented by urban, suburban, and rural residents described by income levels. The map shows the urban, suburban, and rural communities in the Twin Cities metro region based on Thrive MSP 2040 community designations (PDF).
This data was collected through the 2019 Travel Behavior Inventory household survey. More than 7,500 households participated, providing trip information that helps us understand how people travel around the Twin Cities.
The Travel Behavior Inventory household survey uniquely provides the ability to calculate gas consumption based on the kinds of vehicles people own and drive. Survey participants provided the year, make, and model of each vehicle they own, and report which vehicle they used for every trip they made. To estimate the amount of fuel used on each driving trip, we matched individual driving trips to the fuel efficiency of the vehicle used, using the
fuel economy measures provided by the Environmental Protection Agency.