Localized Flood Risk

A changing Minnesota climate has shown that more energy and more moisture in the atmosphere has the potential to create more rainfall.
 
Precipitation has been increasing in Minnesota over the last century, as shown in the Figure below, which illustrates historic annual precipitation, from 1865-2016.

Minnesota Precipitation from 1865 to 2016The blue trend line in the Figure shows that annual precipitation amounts have been steadily increasing, which is compounded by increasing rainfall totals for specific, isolated storms. 
 

These extreme rainfall trends put a strain on stormwater infrastructure and other surface water conveyance or retention efforts. Given the fact that much of the stormwater infrastructure within the Twin Cities metro was designed to convey surface water based on technical standards and rainfall estimations adopted in 1960, the increasingly short, intense rainfalls present a challenge for communities and for the Metropolitan Council.
 
The Fourth National Climate Assessment states that precipitation in the Midwest is projected to increase by 30% by the end of this century. Between 1958 and 2012, the Midwest had already experienced a 37% increase in larger rain events of 2.5 inches or greater.

Why Focus on Localized Flooding?

From an asset management perspective, the financial implications of inaction are well researched and documented. According to the US Federal Emergency Management Agency (FEMA), federal insurance claims for flooding damage averaged $1.9 billion a year annually between 2006 and 2015, making flooding the costliest and most common type of natural disaster in the US.
 
This assessment focuses on the climate hazard of localized flooding for several reasons, including:
  1. Increases in extreme rainfall have already occurred, and this trend shows the highest probability of continuing in the future.
  2. Council assets are susceptible to vulnerabilities from potential localized flooding. Until now, no regional screening tool has been created to assess potential impacts from localized flooding. The assessment allows the Council to screen regional assets for potential localized flood risk and subsequent vulnerability.
To better understand the Council’s approach to Localized Flooding, we advise readers to start with the Localized Flood Risk Introduction prior to reading the individual system-specific chapters. 
 

The metro area transportation and transit network consists of interrelated systems including surface roads and rails, transit services with over two hundred bus and train/LRT routes and related infrastructure, eleven airports, and region-wide dedicated bicycle routes. 
 
To best understand the methods and Council approach employed in creating the localized flooding data layer, please refer to the document entitled Localized Flood Risk Introduction.

The Table below provides a systemwide overview of potential localized flooding impacts to transportation and transit assets. Due to the extensive nature of the transportation and transit network, these system assets are subject to some potential localized flooding impacts. The percentage of total assets within a Flood Impact Zone (FIZ) is relatively low, with 82.6% of all assets outside areas of potential risk. For assets located within hazard areas, more than one-third of all assets fall within the Primary flood hazard, with nearly half of all transit stops and nearly half of all LRT/commuter miles within a Primary flood hazard area.
 

Table - Transportation &Transit Potential Localized Flood Vulnerability by Flood Impact Zone

Transportation and Transit Potential Localized Flood Vulnerability by Flood Impact Zone*Refer to Total Asset in FIZ column to determine total exposure to potential localized flooding for each asset. More than 80% of all Council assets are outside of a FIZ.
**FIZ Average Maximum Depth refers to Primary, Secondary, and Tertiary FIZ. It does not include Shallow.

It is important to note that the Table shows systemwide percentages and averages. Asset-based and site-specific analysis (assessment of a certain bus route, for example) should be conducted to clearly identify and prioritize areas of vulnerability and subsequent site-specific strategies to increase resilience of Metropolitan Council systems.
 
The full Transportation and Transit Chapter describes and maps the vulnerability of each component of the regional transportation and transit network, including the methodology for assessing vulnerability by asset, analysis, considerations for planning and response, and strategies for addressing the system vulnerabilities.

The seven-county Twin Cities metropolitan region is home to a system of regional parks and trails that are nationally renowned for their beauty, size, and variety of features. This system, known as the Regional Parks System, was established in 1974 to provide regional recreation open space for public use. Today, the Regional Parks System consists of 54 regional parks and park reserves, 43 regional trails totaling nearly 400 miles, and eight special recreation features, with an estimated 58.3 million visits in 2017.
 
To better understand the methods and Council approach employed in creating the localized flooding data layer, please refer to the document entitled Localized Flood Risk Introduction.
 
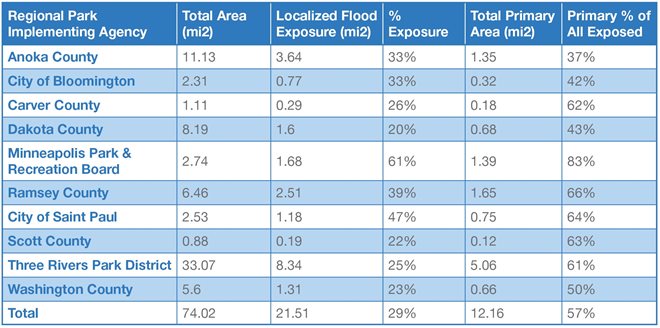
The table below provides information on overall localized flooding potential for each regional park implementing agency, with surface water area removed. The Minneapolis Park and Recreation Board carries the highest percentage of exposure with 61% of the park areas within a potential Flood Impact Zone, followed by the City of St. Paul, with 47% exposure. The Regional Park Implementing Agency with the lowest potential exposure to localized flooding is Dakota County, with 20% exposure.
 
There is variation among agencies in the percentage of park land within the Primary Flood Impact Zone (FIZ). The Primary FIZ are the first areas to fill with localized flood water and therefore tend to carry the highest risk.
 

Table - Regional Parks Potential Localized Flood Vulnerability by Implementing Agency

This table breaks down the regional parks localized flood vulnerability by parks implementing agency. For each agency, total area (mi2), Localized Flood Exposure (mi2), %25 exposure, total primary area (mi2), and primary %25 of all exposed is included. the primary %25 of all exposed for the total of all the agencies is 57%25.

It is important to note that the Table shows systemwide percentages and averages. Asset-based and site-specific analysis (assessment of a certain park or trail, for example) can be conducted to clearly identify and prioritize areas of vulnerability and subsequent site-specific strategies to increase resilience of park assets.
 
The full Regional Parks Chapter describes and maps the vulnerability of different components of the regional parks and trails system, including the methodology for assessing vulnerability by asset, analysis, considerations for planning and response, and strategies for addressing the system vulnerabilities.

Metropolitan Council Environmental Services (MCES) is the regional wastewater treatment provider for the Twin Cities metro area, treating on average 250 million gallons of wastewater from 109 of the region’s communities. The regional wastewater collection system consists of 8 wastewater treatment facilities, about 632 miles of interceptor pipe, 7,550 maintenance holes, 216 meters, and 62 lift stations.

To best understand the methods and Council approach employed in creating the localized flooding data layer, please refer to the document entitled Localized Flood Risk Introduction.
 
The table below provides an overview of potential localized flooding impacts to wastewater assets. Due to the extensive nature of the Metropolitan Council’s wastewater system, these system assets are subject to some potential localized flooding impacts. However, the percentage of total assets within a Flood Impact Zone across all wastewater assets is relatively low, with 76.1% of the highest risk assets, maintenance holes, located outside areas of potential risk. For the maintenance holes within hazard areas, 46.3% fall within the Primary Flood Impact Zone, considered the highest category of flood hazard. Nearly half of all at-risk maintenance holes are located within the Primary flood hazard area.

Table - Wastewater System Potential Localized Flood Vulnerability by Flood Impact Zone

This table breaks down the wastewater system localized flood vulnerability by system assets of maintenance holes, flow meter CTU/PLC cabinaets, meter vaults, and lift stations.
*Wastewater Treatment Plants are analyzed separately in more detail in this chapter.
 

It is important to note that the Table shows systemwide percentages and averages. Asset-based and site-specific analysis (assessment of a certain lift station, for example) should be conducted to clearly identify and prioritize areas of vulnerability and subsequent site-specific strategies to increase resilience of Metropolitan Council systems.

The full Wastewater Chapter describes and maps the vulnerability of each component of the wastewater system, including the methodology for assessing vulnerability by asset, analysis, considerations for planning and response, and strategies for addressing the system vulnerabilities.

In the seven-county region, residents get their drinking water from three main sources: public water supplies from groundwater, public water supplies from surface water, and private wells from groundwater. The Minnesota Department of Health (MDH) regulates the public water supplies, while the supplier manages the system. MDH also regulates the construction of private wells, but the owner is responsible for well maintenance and protection. The role of the Metropolitan Council in water supply planning is to work with regional partners to develop a regional plan, maintain a database of technical information, provide assistance to communities in developing their local water supply plans, and identify approaches for emerging issues.

This Climate Vulnerability Assessment for Water Supply and Localized Flooding focuses on three water supply wells and management areas in the region: 

  1. areas within 50 feet of a private domestic (residential well),
  2. areas designated by MDH as Inner Wellhead Management Zones (IWMZs) around public transient, noncommunity wells (e.g. restaurants, resorts, campgrounds), and
  3. areas designated by MDH as Emergency Response Areas (ERAs) around public non-transient, noncommunity and community wells (e.g. schools, offices, factories, manufactured home parks, apartment buildings, prisons, cities and towns).

To better understand the methods and Council approach employed in creating the localized flooding data layer, please refer to the document entitled Localized Flood Risk Introduction.

The table below provides an overview of potential localized flooding impacts to water supply infrastructure and identified management areas. Water supply infrastructure and management areas vary in type, water source, and location, but are extensive throughout the region and subject to potential localized flooding. The potential impact is relatively low across the three analysis areas. For domestic wells, 7.6% of total acreage intersects with Flood Impact Zones (FIZ). For Inner Wellhead Management Zones (IWMZs), 13.1 % of the total acreage intersects with FIZ, and 16.3 % of the Emergency Response Area (ERA) acreage intersects with FIZ. Of the potentially impacted water supply infrastructure and areas, between 37.2% (domestic wells) and 46.2% (Emergency Response Areas) are within Primary Flood Impact Zones.

Table - Overview of Water Supply Analysis

Transportation and Transit Potential Localized Flood Vulnerability by Flood Impact Zone
It is important to note that the Table shows systemwide percentages and averages. Asset-based and site-specific analysis (assessment of a certain Emergency Response Area, for example) can be conducted to clearly identify and prioritize areas of vulnerability and subsequent site-specific strategies to increase resilience of water supply assets and resource management areas.

The full Water Supply Chapter describes and maps the vulnerability of different components of water supply systems, including the methodology for assessing vulnerability by asset, analysis, considerations for planning and response, and strategies for addressing system vulnerabilities.